Category Data Visualization and Analytics

Visualizing Spatial Data in Oracle SQL Developer

As the official SQL client, Oracle SQL Developer is popular. It offers a function to view spatial data using Map View tool.

Assume you have an Oracle Spatial-enabled database, you have a Shape column with SDO_GEOMETRY data type in your spatial table. This column contains spatial data. How to see the actual map or shapes in Oracle SQL Developer?

Map View Toolbar

First, we may do a query for this spatial table, e.g. SELECT * FROM LGS_Land_Parcel_Geo.

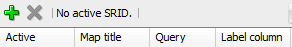
Second, go to SQL Developer menu View \ Map View to turn on Map View panel. Click + button in the toolbar of Map View panel to open Map Query box. Insert above query statement and provide a Map Title for your query. Click OK to close the dialog box.

Map View

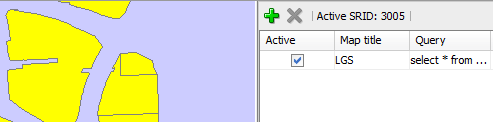
The map of this table shows in left Map View panel...

Read More

Batch Data Processing Architecture for Visualization and Analytics

One of my municipality clients has a requirement to handle batch data from multiple data sources for visualization and analytics needs. The data source can be ERP system, sensors or internal databases. Sensors load data into time series database continuously. It requires BI dashboard show charts based on latest data in near real-time manner.

Let’s see how we design the architecture to satisfy the requirements.

Batch Data Processing for Visualization and Analytics

First, we have data sources listed in the left, including ERP, time series database-based backend systems, other databases and data flow from APIs ;

Second, we have ETL process to load data from data sources to DVA platform. You may choose any ETL tool you like, but we highly recommend Lionsgate Software’s LiveSync Au...

Read More